
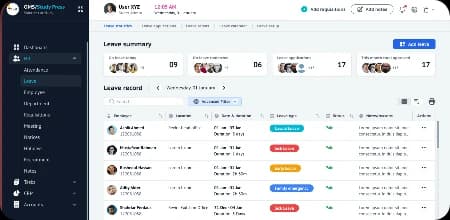





Case study
Connected SaaS Operations
Improving how user activity, subscriptions, product operations, and reporting work together.
Concept example — an illustration of our approach, not a client project.
- Industry: SaaS
- Project Type: Product & Data
- Focus: User Activity · Subscriptions · Product Operations · Reporting
The project
One Picture of Usage, Billing, and Support.
This concept shows how a SaaS product team could connect usage, billing, and operational data so decisions rest on one picture. It describes how we would approach the problem: link product analytics, subscription billing, and support data around a shared customer record, then build reporting that product, finance, and support teams can all rely on.
What We Worked On
- Data Source Audit
- Product Usage Tracking
- Billing Integration
- Support Data Integration
- Unified Customer Model
- Reporting Layer
- Team Dashboards
The challenge
Simple Questions Needed Too Many Tools.
Product usage, subscription billing, and support data usually sit in separate tools, which makes it slow to answer simple questions about how customers use the product.
- 01
Siloed Data
Usage events, subscriptions, and support tickets each live in their own tool with their own identifiers.
- 02
Slow Answers
Questions about how accounts use the product often require manual exports and joins.
- 03
Inconsistent Definitions
Terms such as active user or churned account can mean different things to different teams.
- 04
Limited Operational View
Without a joined-up picture, it is hard to spot accounts that need attention early.
Our approach
Join the Data Around the Customer.
We would connect each data source to a shared customer model so every team works from the same definitions.
Audit
Catalog the tools, events, and identifiers that describe users and accounts today.
Integrate
Bring usage, billing, and support data into a central store through dependable pipelines.
Define
Agree on shared metric definitions and a single customer and account model.
Report
Build dashboards and alerts that answer the questions each team asks most.
The solution
A Shared View of the Product.
The concept brings the data together through integrations and a reporting layer, giving the team one view of user activity, subscriptions, and product operations.
Solution 01 – Data integration
Connected Data Sources
Pipelines bring product events, subscription records, and support activity into one central store.
Solution 02 – Customer model
Unified Customer Record
Each account links its users, plan, billing history, and support activity under one identifier.
Solution 03 – Reporting layer
Product Operations Reporting
Dashboards show user activity, subscription movement, and support trends using shared definitions.
Solution 04 – Team dashboards
Team Dashboards
Product, finance, and support each get a dashboard shaped around their own questions, built on the same data.
Design highlights
Built for Product-Led Decisions.
The concept focuses on trustworthy, shared data so teams spend less time reconciling and more time acting.
Shared Definitions
Metrics are defined once and reused, so reports across teams stay consistent.
Account-Level View
Usage, billing, and support activity can be read together for any account.
Early Signals
Simple alerts can flag accounts whose usage or support activity changes noticeably.
Scalable Foundation
A central data layer makes it easier to add new sources and reports as the product grows.
Behind the experience
Easy to Extend as the Product Changes.
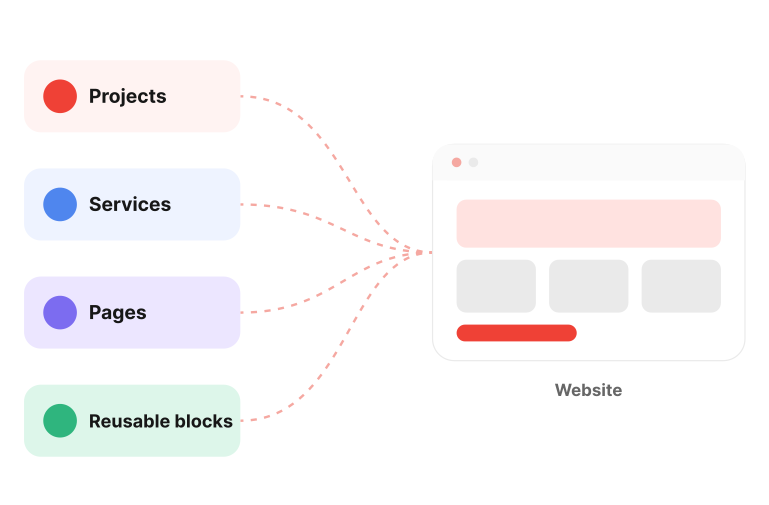
The concept lets the team add sources, metrics, and views without rebuilding the reporting layer.
CMS Capabilities
- Adding new data sources
- Defining shared metrics
- Managing customer segments
- Creating dashboard views
- Setting team access levels
- Scheduling routine reports
Search & structure
Organized for Clear Answers.
Shared definitions and a consistent data structure are designed to make product questions quick to ask and the answers easy to trust.
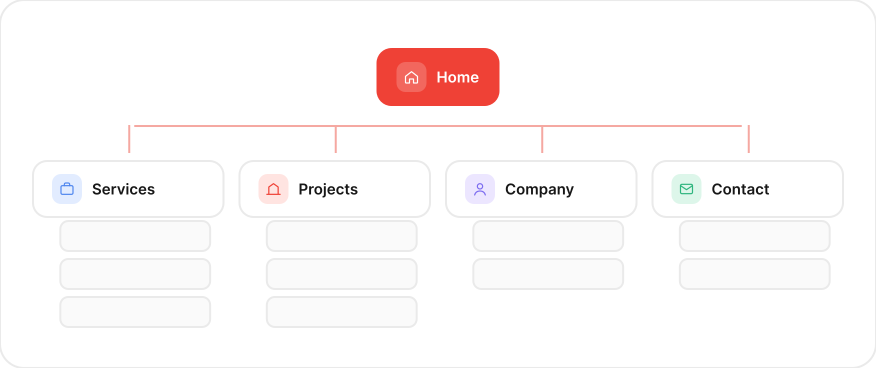
- 01Shared metric definitions
- 02One identifier per account
- 03Consistent event naming
- 04Searchable customer records
- 05Documented data sources
- 06Clear reporting hierarchy
The outcome
Decisions Built on One Picture.
The concept is designed to give product, finance, and support teams a shared view of each customer, and aims to make everyday product and subscription questions quicker to answer.
- Connected product data
- Clearer subscription visibility
- Consistent metric definitions
- Faster everyday answers
- Earlier account signals
- A foundation for future reporting
Project summary
What We Delivered
A concise overview of the project scope, industry, and capabilities that shaped this concept’s digital experience.
Client
- Concept example
Industry
- SaaS
Project Type
- Product & Data
Capabilities
- Data Engineering
- Product Analytics
- Billing Integration
- Data Modelling
- Dashboard Design
- Cloud Infrastructure
- Data Governance


Let’s build what’s next
Ready to Build a Smarter Future for Your Business?
Whether you’re launching a new product, modernizing systems, automating operations, or exploring AI, Vertex can help turn your next idea into a practical, scalable solution.